
The Impact/Effort prioritization matrix is a staple of product management — it’s simple, easy to understand and ubiquitous. You probably already have these two column in your product backlog or idea bank):
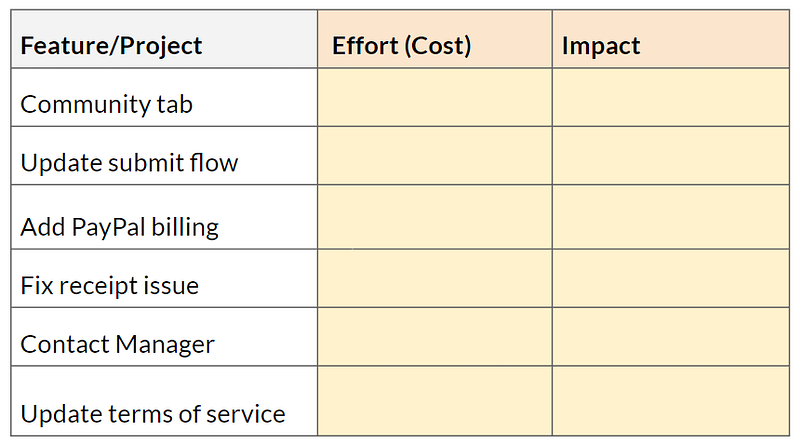
Effort can be stated in person/weeks or simply has high/medium/low. Impact can be graded on a scale, for example 1–5, 5 being the highest, or again as high/medium/low.
Once you have the numbers in place, it’s a matter of picking the features that give you the best bang for the buck. But that’s where things get a little bit tricky. To see why let’s plot the tasks the Effort/Impact axis:
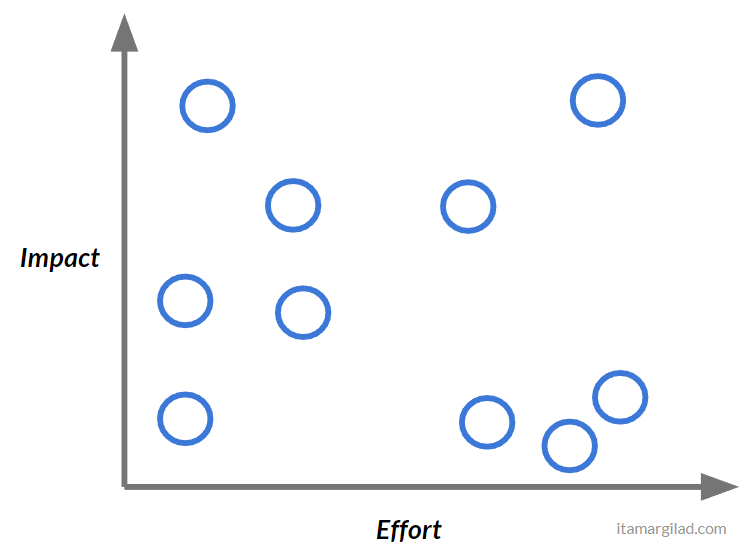
It’s pretty clear that the top-most project on the left is better than everything else, definitely those ones on the bottom right, but how do all the other ones compare?
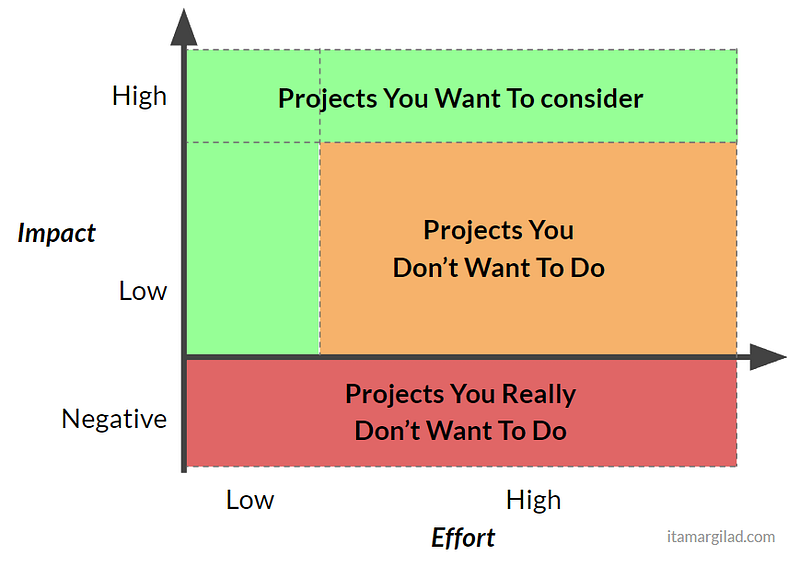
Luckily there’s a solution at hand. You may be familiar with this model — The Impact/Effort Prioritization Matrix. Googling it will give you thousands of results and many variations — this is kind of an industry best practice.
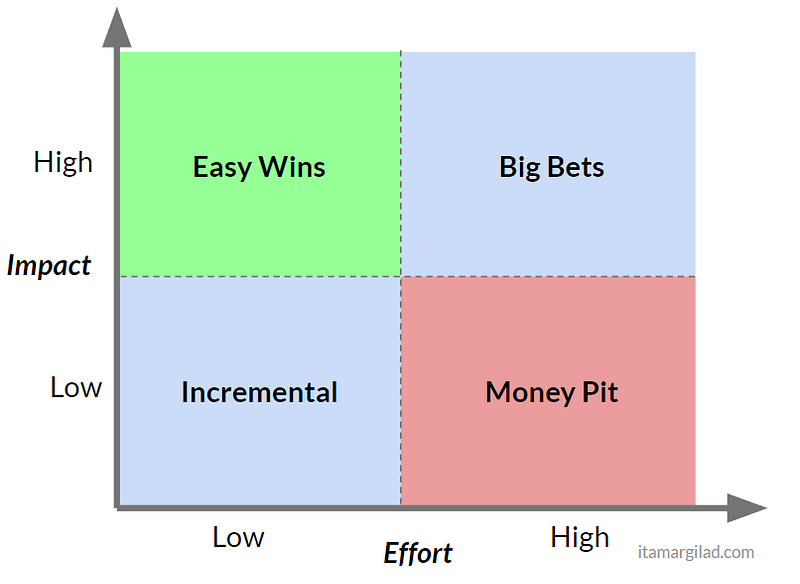
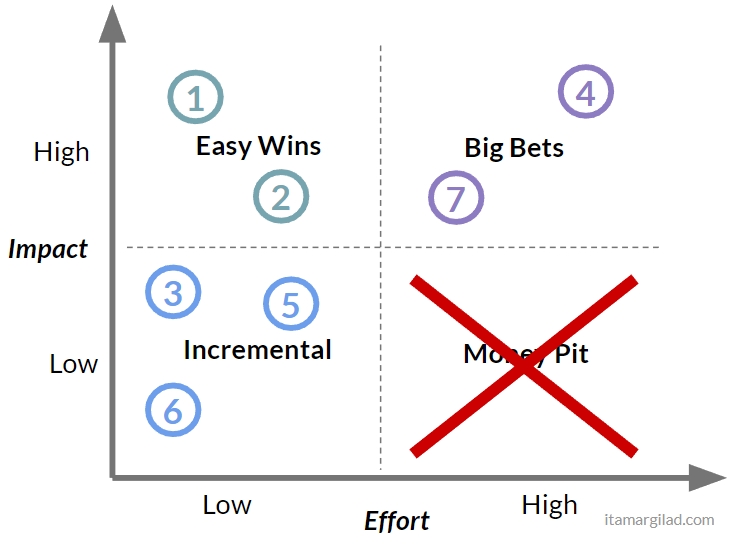
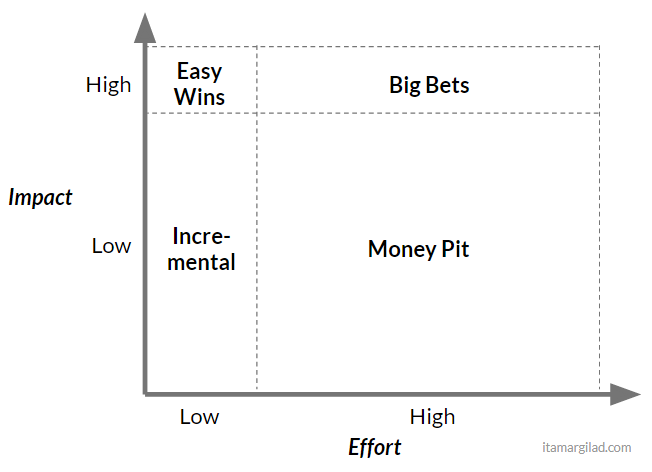
As with most models, the idea is compellingly simple — dividing the space into four quadrants helps us see how projects stack up. The Low/Low quadrant on the bottom left represents small incremental improvements to the product. Every product backlog has many of those and they play an important role as fill-ins, although they are often lower priority. On the opposite end of the matrix, the High/High combination encompasses bigger projects that promise major returns. These are the big bets that more ambitious teams like to take on. Most desirable is the combination of high Impact and low effort on the upper left. No one will say no to an easy win (and who knows, maybe there’s a $300M button waiting to be discovered…). And finally there is the low impact / high effort combo at the bottom right — the so called Money Pit, Thankless task, or White Elephants. We definitely don’t want to spend our limited resources building things that take a lot of work and deliver little returns.
Overlaying our projects on the grid matrix gives an immediate and clear picture:
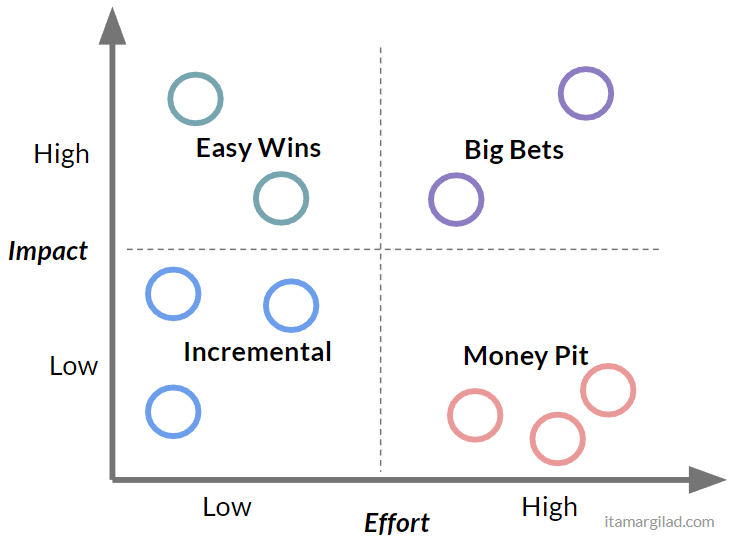
… and now prioritization is quite straightforward:
- First we eliminate anything that’s in the Money Pit (good riddance)
- Next we mark easy wins at the top priorities
- And finally we create a mix of Incremental and Big Bet projects based on available resources and our appetite for big or small projects.
Simple, no?
To receive posts like these by email sign up to my newsletter.
My subscribers also get bonus content, templates, eBooks and more.
Not so fast…
As straightforward as this all seems, there are major problems with Impact/Effort prioritization that cause us to pick the wrong winners. Most importantly Impact/Effort analysis requires us to make somewhat reliable predictions on future events — the effort we will require to complete a task and the value that will be delivered to users and/or to the company once completed. As it turns out both are jobs we’re exceptionally bad at.
The tendency to underestimate effort
In 1979 behavioral psychologists Daniel Kahneman and Amos Tversky described the phenomenon they called Planning Fallacy. They showed that people and teams are consistently overly optimistic about the time it will take to complete a future task, underestimating the actual time. This phenomena has since been confirmed in many different studies.
If you’ve worked in tech for any amount of time this will not come as a huge shock. Tasks and projects regularly run over compared to the plan and it’s not uncommon to have x2-x3 time overruns (and sometimes much more). Experienced engineering leads and project managers are adept at padding estimations, adding project buffers, or just multiplying everything by two, and still almost no project or task finishes on time or ahead of time (example).
There are several reason for this, most having to do with cognitive biases:
- Optimism and wishful thinking
- Inaccurate recollection of the time past similar tasks took.
- Over-focus on execution and completion
- Underestimation of the occurrence of random events
- Scaling issues — as the size of the project increases our ability to accurately project its duration further decreases.
The tendency to overestimate impact
In 2003, Kahneman and Lovallo extended the definition of Planning Fallacy to include the tendency to underestimate the time, costs, and risks of future actions and at the same time overestimate the benefits of the same actions. In other words our bad projections result not just in time overruns, but also in cost overruns and benefit shortfalls.
In tech we’re somehow blissfully unaware of this. Time after time I see managers and teams trusting their gut feeling when assessing future impact, irrespective of how well past predictions performed. The two main contributing factors are:
- No clear metrics — often whether a project or task were successful or not is a matter of interpretation because no success criteria was specified in advance.
- We tend to remember our good predictions and forget the bad ones (or attribute them to others).
Once systematic measurements of success/failure are in place we get a clear, and very sobering picture of how little we can predict impact. Analyses of A/B experiments conducted independently by Microsoft, Netflix, Booking.com and other companies had shown that at best 1 in 3 ideas tested created any measurable positive results. The other ideas tested yielded either no impact or negative impact. These numbers are not reflective of the broader industry, though. 1 winning idea in 3 should be is a very good result, possible in mature products and companies that have spent a good amount of time researching their users and customers. Your typical startup project will most likely yield 1-in-10 ratio or worse, slightly more mature companies can expect somewhat better odds.
“It is humbling to see how bad experts are at estimating the value of features (us included). Every feature built by a software team is built because someone believes it will have value, yet many of the benefits fail to materialize.” Microsoft research paper, 2009
John T. Gourville of Harvard Business School described in a 2006 paper a strong mismatch between the value companies expect their innovations will deliver to customers vs. the value customers actually see in the product. According to Gourville the companies tend to overestimate the product benefits, while the users actually put much more value in their current solutions (endowment effect) and overestimate the costs of switching to the new solution. According to Gourville companies overestimate value by a factor of 9.
Want to learn more? Interested to bring these concepts into your company? Check out my workshops and keynotes.
The Impact/Effort Matrix Revisited
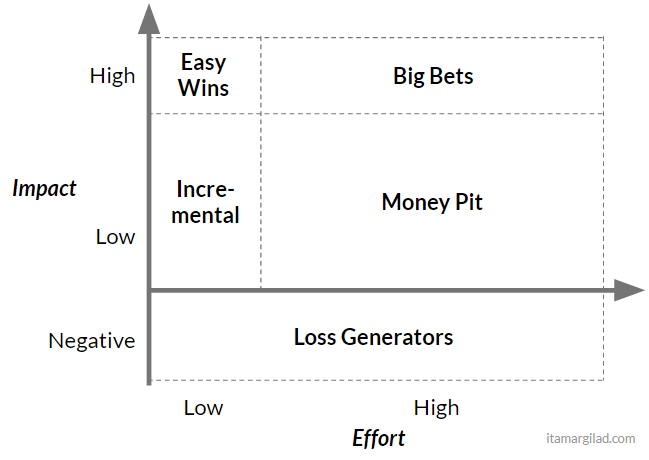
So projects tend to be both more costly than we to think and deliver less value. Looking back that “the matrix” it means that things actually look more like this:
Yes, the area you are most likely to hit is the Money Pit.
But it gets worse. As A/B experiments analyses show, some projects actually generate negative results — something that almost no development team ever considers. So, there’s an element of risk which is not reflected in the matrix.
The real Effort/Impact matrix probably should look something like this:
Overlaying the projects on this updated matrix tells a new, and less optimistic story. Some projects that before were slotted as “Big Wins” are actually “money pits”.
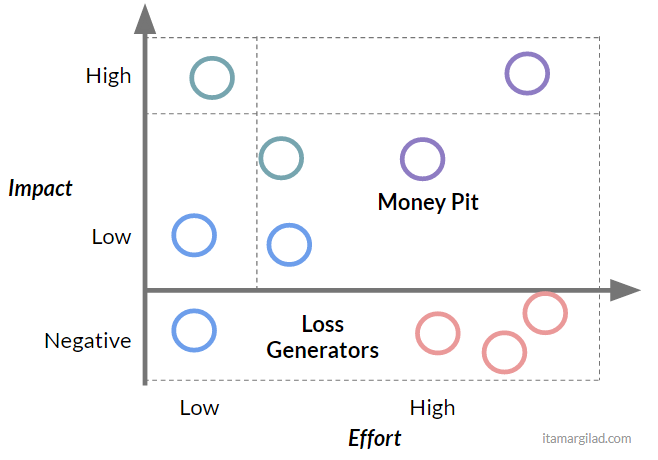
I think this is a good point to say goodbye to the impact/effort matrix. It’s a model that is overly simplistic and it assumes that we can say with some confidence how much things will cost and how impactful they will be in advance. If there was such a matrix (and I don’t think there is one) it’ll probably look something like this:
Five ways to make Impact/Effort prioritization work
First you should come to grips with the fact that 60–90% of the projects in your product backlog are not worth doing — they’re just not going to yield any meaningful results and/or are going cost more than you want to pay. Prioritization and experimentation are needed to find those few gems that are worth doing (they’ll be late too, by the way, but that’s OK).
Second I still advocate Impact/Effort analysis as a very useful too. In fact I often recommend it to the companies I work with. However I also encourage them to do a little bit more work to improve their prioritization.
1. Do back-of-the-envelope impact calculations
You can usually gain significant improvement in the accuracy of your estimations by taking a few minutes to break them into their parts and placing guesstimates on the subparts. A favorite example of mine is product-based marketing campaigns that rely on notifications or in-product promos. They somehow always promise to boost conversions or revenue by “10%”, but when you actually calculate how the funnel will works — how many people will see the thing, what % will click through, and of those that click what % will convert, shrink to fractions of percent improvement rather than 10%. Yes, an error of two orders of magnitude can be uncovered in less than two minutes.
2. Use available data or new data
Often data we are already collecting can immediately tell us how valuable a feature or project can be — usually by comparing to something very similar that we already launched. For example other in-product promos can tell us what CTR we may expect from a new one. In features or projects that may require significant work, it’s sometimes worthwhile adding events and counters to collect missing data that will help with evaluation.
3. Think of low-cost ways to validate your assumptions
For bigger projects it’s often worthwhile doing some preliminary research:
- Surveys
- Smoke Tests — for example a “fake door” Facebook campaign.
- User Interviews
- MVPs
You don’t have to do this for every feature as its hard to scale.
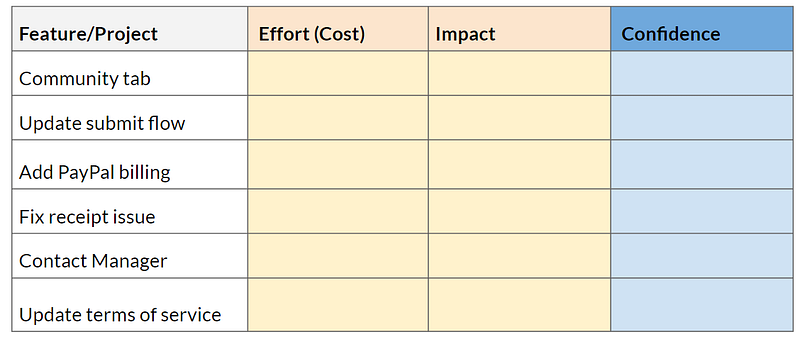
4. Factor in Confidence
Now that you know what effect underestimation of effort and overestimation of impact can have, you may wish to add another column — “Confidence” to your product backlog to show how well-based we feel effort and impact estimations are.
Very low confidence can be 0.1, very high confidence maybe 0.8 (more information on confidence scores here)
The prioritization formula is then: Prio = Impact / Effort * Confidence
Update: A free confidence calculator is available on my site.
5. A/B tests
A/B tests eliminate almost all of the guesswork and most of the risk. If you A/B test a feature before launching you don’t need to rely on guesstimates and gut feelings — you’ll see soon enough if the thing works or not. A/B thus allow us to make big bets with relatively low risk. For this reason company such as Netflix A/B test everything, both big and small changes.
Update: Read about A/B testing and dozens of other idea validation methods in my free eBook: Validating Product Ideas.
To receive posts like these by email sign up to my newsletter. My subscribers also get access to bonus content, templates, eBooks and more.