Imagine finding yourself in an elevator with your CEO or top investor. After a brief hello she lands the big question on you: “How is the product doing?” You have 30 seconds to answer. A simple “all good” won’t cut it — you need numbers. Your mind runs through your dashboard. Each metric conveys a part of the picture, but in isolation is not meaningful enough and might confuse the exec. If only there was one easy-to-understand metric that would capture it all…
Guess what — it’s not just CEOs and investors that needs this metric. Your team, manager and stakeholders would benefit it from it too, as would you. Too many products and companies have sailed blissfully into failure, simply because they were unable to track the bigger picture clearly. Today, many believe that capturing the true north of your product and business in one metric helps in setting direction, driving focus, measuring progress, creating alignment, and achieving success. It’s a compelling idea, one that Netflix, Booking.com, Ebay, AirBnB, and others have implemented to great effect.
Still, there’s a lot of confusion around this topic. In practice companies struggle with settling for just one top KPI, and with good reason. The terms are not very clear either — North Star Metric, One Metric, top business KPI — are these all the same? Are they different?
In this article I’ll summarize what I consider to be the best approach to setting top level metrics. Read on to learn how to put to use this powerful technique.
The Value Loop
At its heart, the core mission of every org is to deliver value, ideally to a big market, and to capture value back.
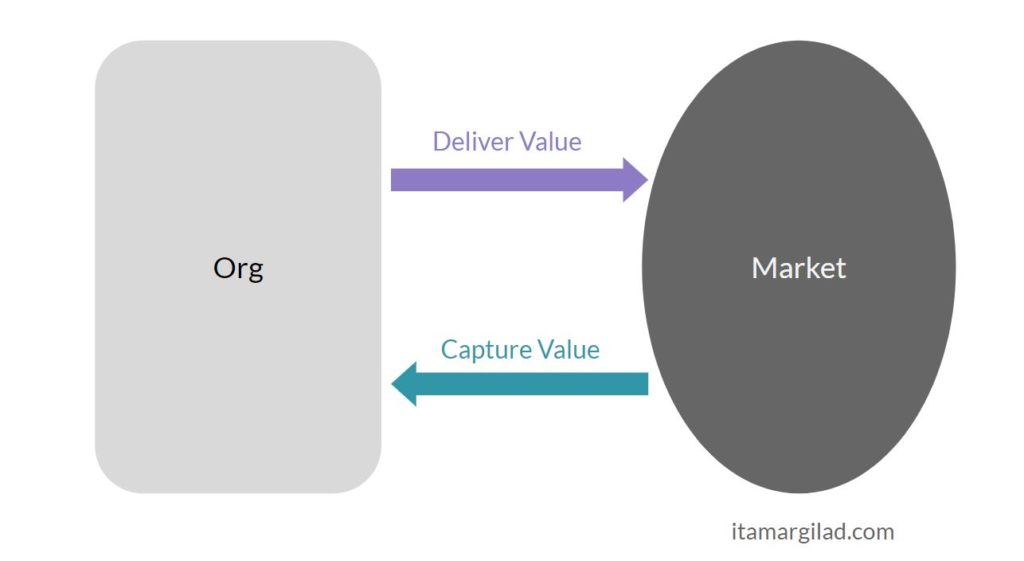
The most successful companies tie the two to create virtuous loops. The more value you deliver, the more you’re able to collect back. The more value you capture the more money, data and other resources you have to invest in delivering yet more value to the market.
To build a virtuous value loops around your product you have to first define what value you deliver and what value you wish to capture. Then you have to measure both.
The Top Business KPI
All companies measure captured value — these are the familiar Key Performance Indicators (KPIs): Revenue, Net Income, Paying Customers, Active users, etc.. While it’s tempting to try to grow all at the same time, smart leaders know this will create suboptimal results. They therefore pick just one KPI that is most reflective of the company’s current business objective. For hyper-growth companies it may be the number of active users, at the expense of profitability (see Amazon, Uber, etc). For pre-IPO companies it may be hitting a certain revenue target etc. Either way there’s tremendous power in stating: “Our goal is to achieve sales revenue of €150Mn by end of 2020”. The org will gain focus and sense of direction, and you’ll improve the chances of hitting the target.
Upcoming Workshops
To learn hands-on how to use this and other product management topic check out my workshops: : itamargilad.com/workshops
The North Star Metric
But captured value is only half of the value loop, and arguably not the most important half. Delivering high value is not just a matter of altruism, it’s genuinely the best thing you can do for you business. It’s far easier to acquire and retain customers with high value products, you can charge more for them, and you’ll likely need to spend less on promotion (Google famously ran its first TV ad for Google Search in 2010, 12 years after the product was launched). Smart companies understand this and optimize for value-to-customer — they continuously measure and set goals for the amount of value they deliver. This is the job of the North Star Metric (NSM).
Growth guru, Sean Ellis, defines the north star metric as the “aggregate value that people get from you product, … your value footprint”. We’re looking for a number that will sum up the value across your entire market and grow “up-and-to-right” over time.
Here are a few examples of NSMs (some taken from Sean’s book Hacking Growth) :
- WhatsApp — Messages sent
- YouTube — Minutes watched
- eBay — Gross merchandise volume (GMV)
- Airbnb — Nights booked
- Facebook — Daily active users
- HubSpot CRM — Weekly Active Teams
WhatsApp users come for free, rich, secure messaging. Each message sent is therefore an increment of value. If the total number of messages is growing, this is most likely a positive sign that the company is accomplishing its mission. Similarly, every minute of video watched on YouTube is a net positive for the viewer looking for free, good content, and for the uploader. eBay and Airbnb are two-sided marketplaces, and therefore their north star metrics are about connecting supply with demand and facilitating transactions. Airbnb measures this in terms of nights booked, while eBay looks at the total monetary value that changes hands. The more active users there are on Facebook, the more these users are likely to find the people and content they are looking for and the more likely they are to share and get reactions back. HubSpot, a maker of inbound marketing and sales cloud tools, measures the number of active teams they serve, as the tools is of highest value for teams.
The NSM and the Top KPI are not enemies
Here’s the biggest source of confusion I see — many people believe you have to pick just one top-level metric and call it the North Star. Given this choice most leadership teams will pick a business KPI (“Our north star is profit”), and push back against a company-wide value-delivered metric. In practice it’s important to define, measure and set goals for both . The NSM is the guiding light for the parts of the org whose job is to deliver value — engineering, product, design, dev-ops, customer support, while the Top business KPI helps guide the teams that are most concerned with capturing value — sales, marketing, business dev, finance etc. Having just one top level metric will leaves a large part of the org disoriented.
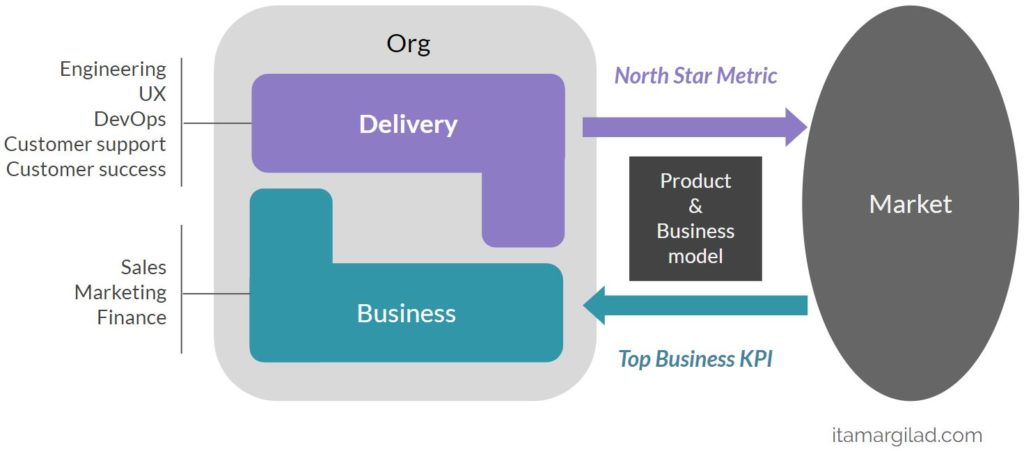
There’s another reason to track both. In healthy companies the NSM and the top KPI are highly correlated — they grow and decline in sync, or with some delay. Focusing on just delivered value (typical of engineering-driven orgs) or just captured value (typical of sales-driven orgs) exposes us to an imbalance that is not sustainable long-term.
Aligning the NSM and the Top KPI
Alignment between your top metrics is something you need to build into your product and business model. A good way to test this is to decompose the North Star Metric and top business KPI into their supporting metrics trees and check how much overlap there is.
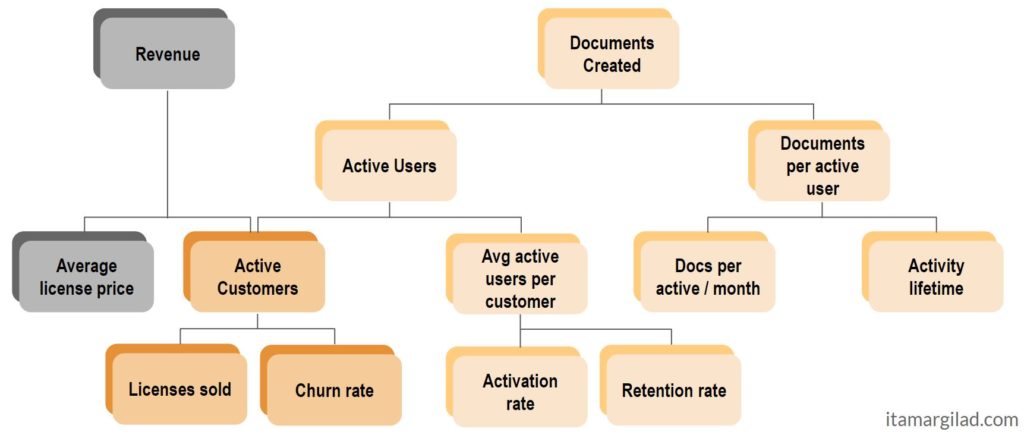
We want to see a good amount of overlap between the two trees, meaning that some part of what the delivery team is doing is directly contributing to the top KPI, while another part is focused on delivering more value to customers. Conversely it’s good if some part of what the business team is doing is directly contributing to growing the north star metric.
More generally we can see four cases as shown in the diagram below.
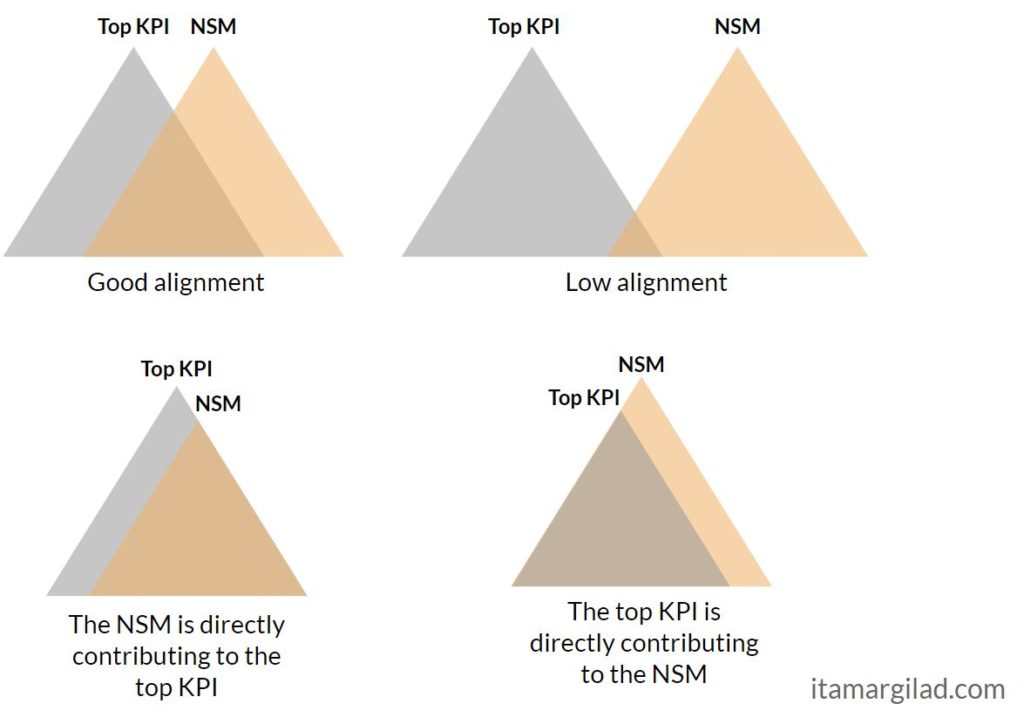
The case we wish to avoid is that of low alignment between the two metrics. Imagine a company developing a successful freemium messaging product, that sets the NSM to be number of sent messages. However the company is setting its sights on selling to Fortune 500 companies and hence the top business KPI is number of enterprise customers. Enterprise customers don’t buy through a freemium model and likely have very different needs to those of the free or low-price-tier user. In this case a lot of what the delivery team will do will not directly contribute to the needs of the business. This misalignment will be felt across the org. Note that the root cause here is wrong mission (how we deliver value) or wrong business model (how we monetize the value). The metrics are just a reflection of those.
The One Metric That Matters
Most people first heard of theOne Metric That Matters (OMTM) through Alistair Croll and Benjamin Yoskovitz excellent book “Lean Analytics — Use Data to Build a Better Startup Faster”. Croll and Yoskovitz define the OMTM as the “one number that you’re completely focused on above anything else at your current stage”, and that “answers the most important question you have”. Some people (me included) assumed this to be the same as the north star metric, and started using the terms interchangeably, but actually often that’s not the case. The OMTM isn’t about measuring value delivered or captured, it’s about finding a key metric that enable both to grow.
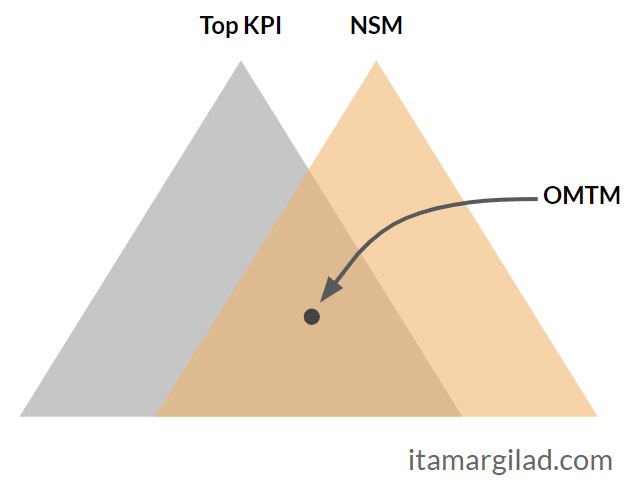
The north star metric and top business KPI are usually too high-level, and dependent on too many factors to influence directly. The OMTM is designed to be actionable. For example for many SaaS companies keeping paying customer churn below a certain threshold is key for success, so focusing the company on churn and using a combination of customer success, customer support, renewal promotions and other techniques can be the most important thing to do. The OMTM brings focus to your tactical execution, while the NSM and top KPI set the strategic goals.
Takeaways
- If you want to align the entire company around just one number — use the north star metric — the measurement of total value you deliver to the market.
- Often you’re better off giving you business team their own north star in the form of (just one) top business KPI.
- Still make sure that the two are highly aligned — use the right mission and business models and check how well their metric trees overlap.
- Use OMTM to set actionable tactical objectives with high focus.
Join 15,000 product people who receive my articles, tools, and templates in their inbox
